GIS Productivity
Oil and Gas
One of my first projects as an independent consultant, this was a productivity project that expanded to include some visualizations. My client was spending countless hours manually pulling gas well data from various web sites, transforming the data, and integrating it with their existing ArcGIS systems. I proposed a system for scheduled web scraping, automated data transformation, and persistence in a PostGIS database. I created a front end that allowed them to configure and customize various aspects of the entire system. My client needed several specific services to perform GIS data transformations as well as specific geo calculations to aid in their analysis. Additionally, I was able to provide a mapping front-end based on Google Maps.
The Stack
I was already comfortable building web applications with django and postgresql. Shortly after studying the requirements of this project, I discovered geodjango and the rest is history. I was already sold on postgis, so geodjango saved me a ton of work at the ORM layer.
Task Queues
We needed a flexible way to run asynchronous tasks at various intervals. Some tasks needed to fetch data and perform ETL while other tasks needed to work on a queue of user-initiated calculation jobs. I used RabbitMQ and celery to support queueing and distribution of the tasks to worker hosts as needed.
GIS Capabilities
We needed to perform a variety of GIS-specific operations ranging from simple to somewhat complex:
- Create buffer regions around pipelines
- Select wells within a predefined region (and query based on other attributes too)
- Merge pipeline segments
- Process 2-way conversion between shapefiles and KML files
Sometimes, I needed to move outside the world of geodjango and create custom queries, but that was the exception rather than the rule.
Visualization
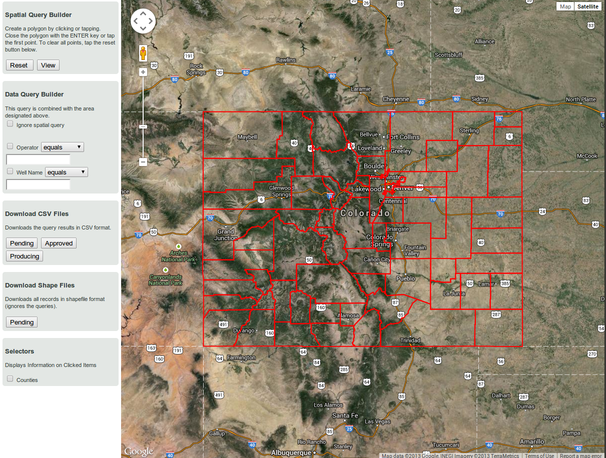
Using the Google Maps API, it was easy to add an interactive geo-based query capability. The query page started with the entire state of Colorado. The controls for data-based queries are on the left side of the page.
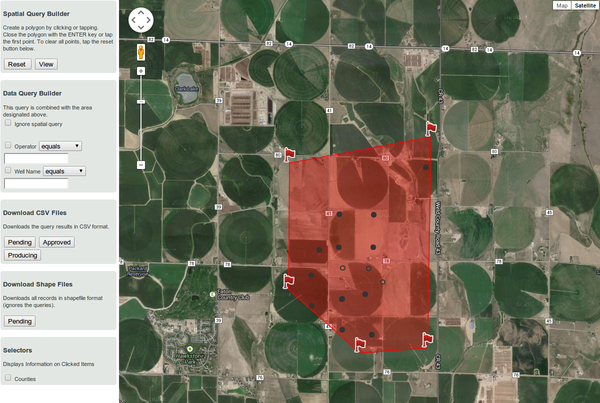
Using familiar Google Maps navigation, the user zooms to the area of interest. At that point, the user can create a custom polygon by clicking vertex points on the map. This constrains any future data queries to retrieve objects within the selected polygon. In this case, gas wells become visible after the query has completed. They are color-coded based on prior customization.
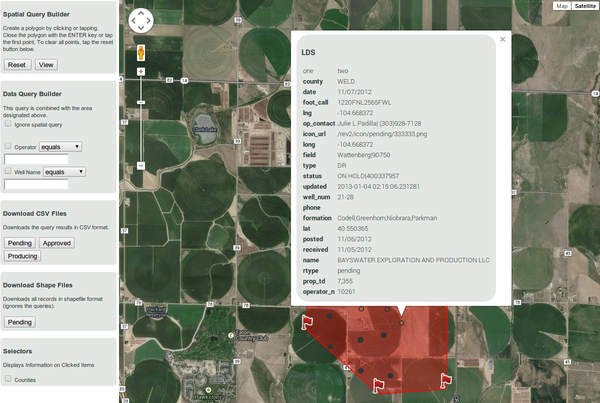
A click on any of the gas wells will display more details.
A Powerful Combination (at first)
The stack I used in this project proved that it could handle these specific scenarios well. As we continued our daily database updates, we began to notice the expected data-scaling issues. Most of the time, these issues manifested themselves in the form of higher delays. In extreme circumstances, the application would require more memory than the host could give. This would cause an application restart with obvious undesired effects. Before I knew it, I was spending more time on data-scaling issues than actual application functionality. Fortunately, I was able to leverage some sharding techniques to prevent queries over an unusually large data set. Stay tuned, as I will cover these challenges in part 2 of this project…